Group Analytics
A solution to give customers a way to benchmark their end-customer groups against each other using simple data visualizations.
Project Overview
Skilljar recognized the increasing importance of visual data analysis in empowering Program Owners to effectively convey the success story of their customer education initiatives. By integrating assets that facilitate simple yet impactful visual representations, program owners can present a compelling narrative that highlights the value and impact of their customer education programs.

My Role
For this project I was able to contribute in many ways, including: early mockups, collaborative presentations to skate holders, usability testing and specifications.
Challenges
The project presented several challenges, marking the first instance in my design career where I was tasked with crafting a solution through data visualizations. Key challenges included understanding how users interact and consume data, determining the most effective visual elements and understanding the best filtering method. To overcome these hurdles, I conducted thorough research, consolidating my insights into a comprehensive "best practices" document using Google Docs with user experience recommendations. Additionally, I faced the challenge of optimizing the use of existing components to account for the project timeline, reducing the need for Front End Engineer resources to create new components and ensuring consistency throughout the product.
Ideation
With a solid understanding of the problem, personas and data visualization and filtering best practices, I developed mockups. These mockups underwent an iterative presentation process to stakeholders, gathering feedback on the potential solution. After each presentation, I incorporated the feedback into further design iterations. When the solution reached a point where stakeholders were satisfied, we conducted a usability study.

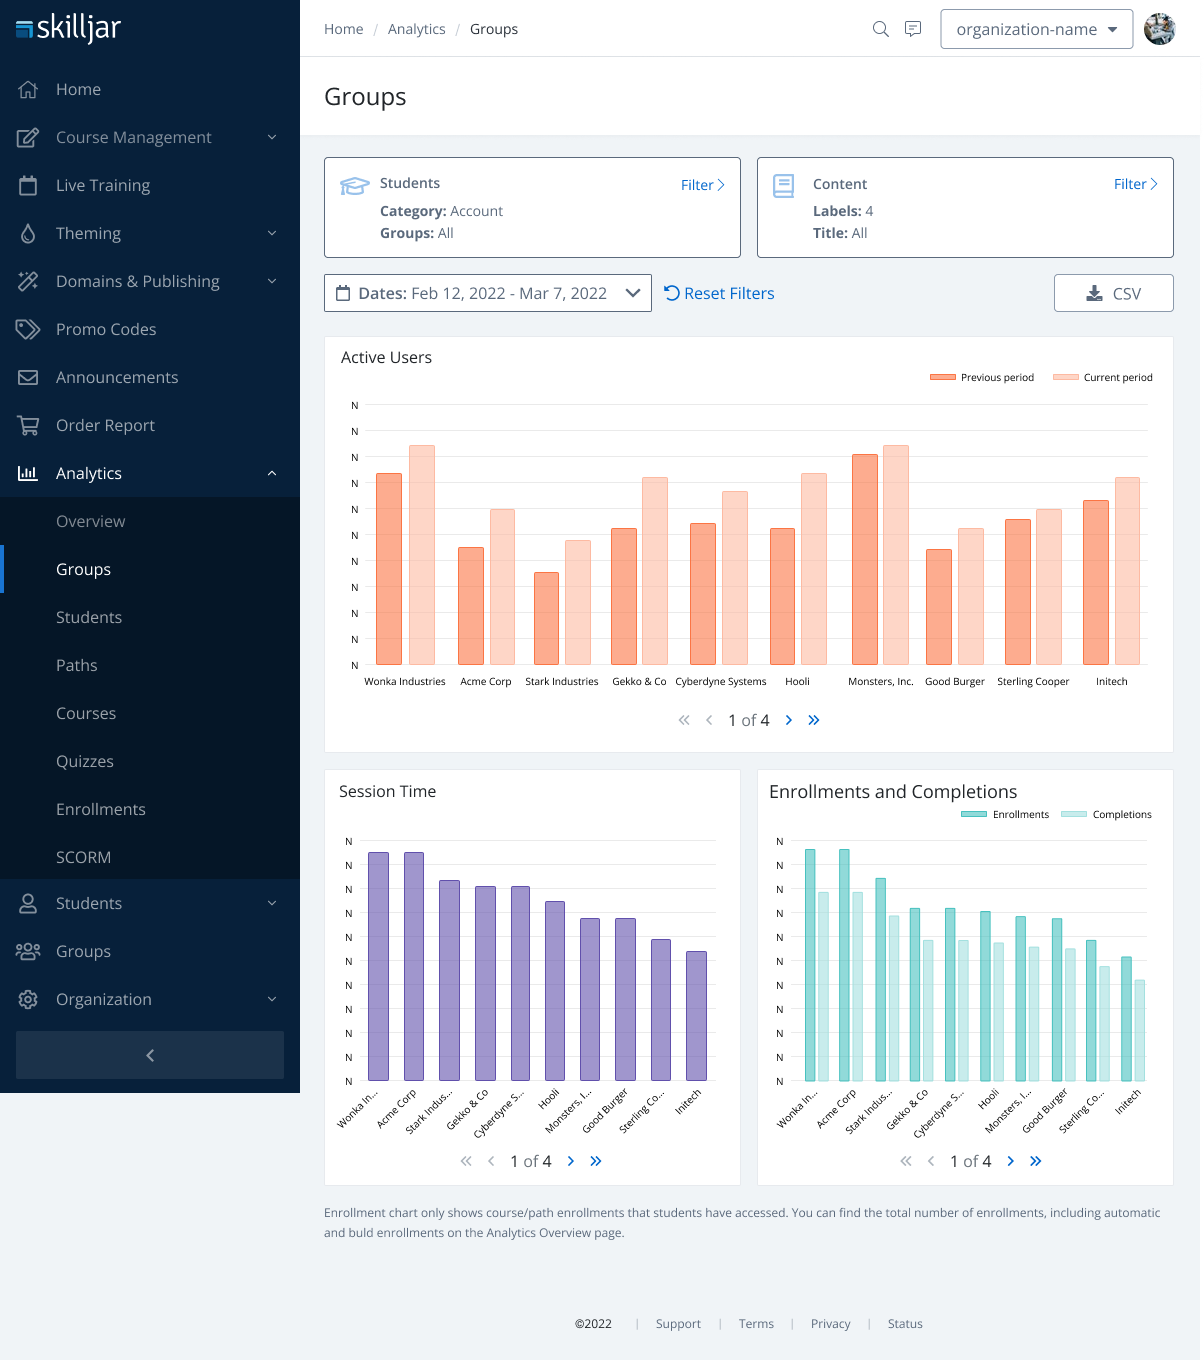
This is a screenshot of early mockups. This was the first iteration used to present potential solutions to stakeholders.

Advanced filter ideation.

At this point the stakeholders were satisfied with the solution and we tested with this iteration.
Usability Testing
We executed a remote moderated study. I developed a script including an introduction, preliminary questions, and tasks. The script incorporated a mechanism for participants to rate each task, utilizing a Likert scale to gather quantitative feedback on the ease of use for each specific task. I facilitated the study while a Senior Designer and Product Manager observed and recorded notes.
Resources were limited, allowing for only one round of usability testing. Overall, participants perceived the feature as clear, straightforward, and easy to navigate and filter. The majority of participants successfully completed tasks with ease or encountered only minor mistakes.
The test identified two minor usability problems:
Sorting the data
Downloading the data
A findings report was written following the study that summarized all of the feedback that was captured. This report was shared with the stakeholders and included a section for recommendations for iteration.
Specifications & Hand-off
Following usability testing and iterations, specifications were created. Once the specifications were finalized, a meeting was conducted with the front-end engineering lead, engineering manager and product manager to facilitate the hand-off and address any questions raised by the engineering team regarding the specifications. Typically, a few areas require updates to enhance clarity for the engineering team.
The final phase involved a design review. As the solution was being implemented, I conducted regular reviews of both components and the user experience. This process was facilitated through the project management tool Jira.

A screenshot of the specifications written in Figma

Granular view of chart specifications.

Granular view of filter empty state specifications.
Check out my other work